Audience prediction in DOOH
“You can’t connect the dots looking forward; you can only connect them looking backwards”
Steve Jobs
This quote from Steve Jobs applies to audience prediction for Digital Out of Home advertising in a way that has only just become reality using currently available tools and platforms.
In the world of Digital Out of Home (DOOH) the ability to look forward and have those dots connected is very powerful indeed. Who amongst media owners, planners and buyers of DOOH wouldn’t want to know how many audience impressions a particular screen will reach next Tuesday afternoon? Particularly such information would be invaluable to the Programmatic DOOH ecosystem for both planning and pricing. Predicting the right audience at the right time should surely be one of the primary goals for any DOOH campaign.
In this article we at Crowd-Sense would like to discuss the science of audience prediction within DOOH and its use within programmatic.
To start lets briefly review what programmatic is in term of DOOH and its dependence on quality data.
Programmatic DOOH refers to the automated buying and selling of digital billboards and screens and also the improvement of this process by the richness of applied data. One of the major aims of programmatic is to increase the efficiency of the DOOH media buy. How can a client’s valuable DOOH media budget be best spent targeting a desired consumer audience? Another aim is to use data to drive dynamic contextual content to DOOH screens, and yet another the automation of the planning, availability checking and buying process.
Data is the lifeblood of programmatic and it has many sources including mobile phone SDK data, data from sensors such as cameras, public and commercial sources and also customer supplied data. The nature of this data is just as varied as its sources and it falls into three main groups.
The first is audience segmentation data, used to classify the proportional composition of the audience for a DOOH screen at any given time. Typical sources of segmentation data are mobile phone SDK data, processed image data from screen mounted cameras, public sources such as census data and commercially available models of audience constitution. It is worth noting that audience segmentation can only really be defined as fractional value of the total adult audience, for instance 55% of the audience are 25-45 year old females, and not a specific value.
The second is event data, often used to drive dynamic or adaptive DOOH content such as weather data, real time flight information or sports scores. An advert may be triggered to play only when the pollen count is high or include real time football scores or overhead plane details within its content.

Lastly there is actual audience impressions data, the number of all adult impressions that have been measured within the view shed of the screen. The view shed is the area surrounding the screen where a played advert can effectively be seen.
However rarely mentioned is predictive. We at Crowd-Sense believe this is to date a seam of opportunity that is yet to be mined in the DOOH industry.
Exploiting the data sources mentioned above planners are able to create campaigns targeting a specific audience, 18-35 year affluent women for instance, on DOOH screens in a particular area, say within a 5 minute driving distance of a clients retail outlet, when a particular weather event is experienced, such as sunshine.
But what about the amount of people? Common sense might tell us that of course more people are out and about when it is sunny rather than raining. But is it that simple, is it every time there is some sunshine? Or is it more nuanced than that such as the first appearance of some sunshine after a period of inclement weather.
Rather than guess we at Crowd-Sense decided to let the data do the talking. Firstly, we set about creating a cost-efficient way of measuring audience impressions and the Crowd-Sense collector was born (Measurement in Digital Out of Home). We then used collectors installed in 160 DOOH screens at over 100 different high traffic areas to collect impressions data within the screen view shed over a 12-month period. Alongside this data we also captured allied hourly data such as weather, sunshine, air temp, precipitation, wind speed etc.

Then we decided to look into what the impression data, when used by itself and then in conjunction with the other sources, could predict about the future.
We started simple. With the constant reminder that history tends to repeat itself we decided to evaluate this so we first looked at what a rolling average of historical impressions data could tell us about the future. What was the best period to look back to accurately look forward, and what sort of accuracies could be achieved?
After running numerous experiments based on the impressions data we collected we found that a rolling four-week average of figures was optimal. This could accurately predict the next weeks hourly figures to an accuracy of plus or minus 20% about 80% of the time. Not bad for a starting point. Any shorter period for the average, say two weeks, or longer, say eight weeks, degraded the accuracy. Obviously over the medium-term people are creatures of habit.
Next, we looked to machine learning in an attempt to improve the accuracy of prediction. Essentially using the exact same data as was used to create the rolling four-week average we built standard AI (Artificial Intelligence) regression models. The best way to picture these are imagine all your data is plotted on a graph and you ask the model to produce the best fit line, curve or plane that represents all the data points.
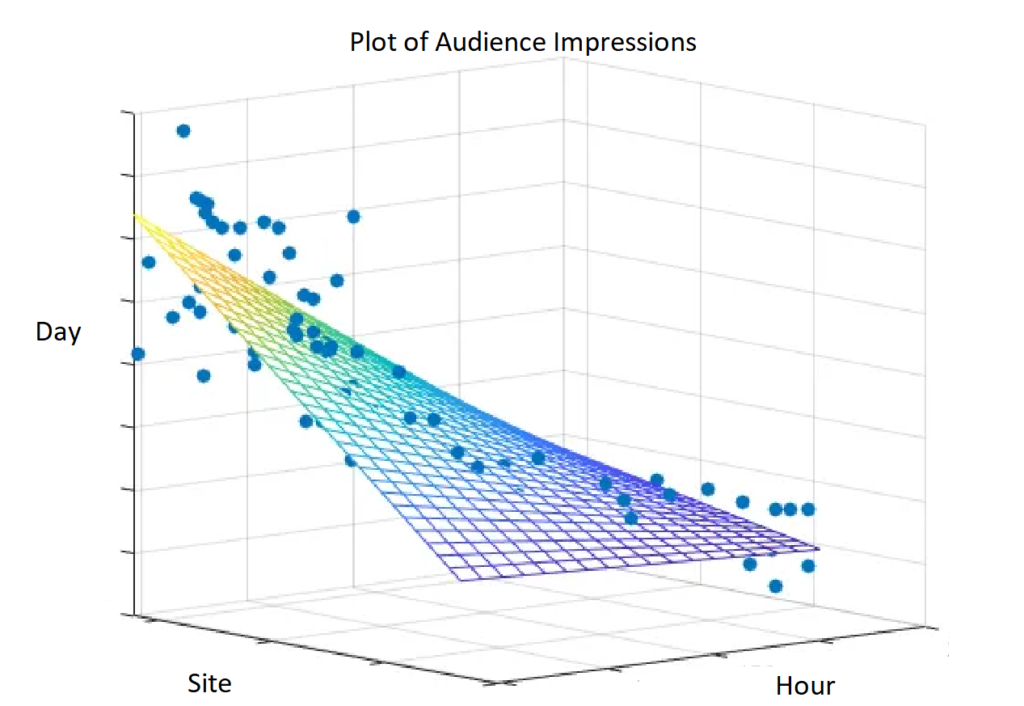
Prediction is simply then a matter of supplying the values for the variable you want to predict, say day of the week, hour and site, and then reading off the value from best fit plane where these variables coincide. The clever part about using AI models to do regression analysis is that you are not limited to two or three sets of variables. Although difficult for the human mind to visualise the models can be built with almost limit less sets variables and through analysis and experimentation, and a lot of data, only those variables that have the most affect on the resultant audience impression figure can be identified. These standard regression models started to yield better prediction results and gave us to predict the next weeks hourly figures to an accuracy of plus or minus 10% about 85% of the time.
We then moved on to a more complex but also more powerful AI model, a convolutional neural network (CNN). These models aim to replicate in some part how the human brain achieves pattern recognition. Like standard AI regression models CNNs can take multiple variables as input and can be trained make predictions on output. A benefit is that they can also be tailored more acutely to overcome some of the issues seen in training predictive models. The main issue to overcome is that of over fitting predictions based on the data they have been trained on which can make the model very good at predicting output for set of values is has seen before but not for ones that it hasn’t.
The longer you look back, the farther you can look forward.
Winston Churchill
Churchill’s words couldn’t apply more when it comes to AI Models. More site data leads to improved predictions for all our models so far. A rolling average requires a minimum of four weeks of data, while other models require at least six months for optimal results. When we introduced weather variables in our CNN models we found that although we achieved our highest level of predicative accuracy, predicting next weeks hourly figures to an accuracy of plus or minus 5% about 95% of the time, at least six months of data was required and preferably more than twelve.
The advantage of these models is their ability to improve with more training data. Our models are updated weekly with the latest audience impression data from our collectors, and made available to customers through an automated data feed or report. This enables customers to:
- Determine hourly CPM pricing for their digital screens with audited figures.
- Make precise predictions for client campaigns and estimated impressions.
- Analyse the effect of external factors, such as weather, on audience impressions.
To enhance the precision of audience impression prediction, additional variables can be incorporated in the future, such as bank holidays, sporting events near screens, and national strikes etc.. The Crowd-Sense collector, a standardized method for measuring audience impressions, along with its reliable continuous measurement service, provides the foundation for achieving accurate audience impression prediction for the first time.
With tools like these Crowd-Sense can’t quite give you a perfect vision of future audience impressions but we can give you better glasses to look at it with and the lenses in those glasses just keep getting better and better.